

Quite often I find investors cling on to their investments and lose sight of other opportunities with better risk and return profiles. Gold and Fixed Deposit (FD) are two such favored traditional investment products which have found a lot of takers. Gold and FD have historically been legacy products, more so Gold which is an inextricable part of Indian tradition. We pass it on to the next generation and believe that it is the safest and most wise investment choice and shall be our last resort during bad times. FD has been more of a default investment choice for most investors besides traditional insurance policies. I find these choices strange because while FD offers extreme safety with fixed returns, Gold is highly risky with returns linked to geopolitical factors, currency fluctuations and a host of other factors which aren’t domestic.
The comparison between these two asset classes and Equities throws up some interesting findings in favour of Equities. However, that doesn’t necessarily answer the question of which of these is the right investment choice for you. Read on to know more on that.
Fixed Deposit vs. Gold vs. Equities
Cutting to the chase, for the last 35 years, in absolute terms Gold has delivered a return of 8.52%, Fixed Deposit 8.91% and Equities (BSE Sensex) has delivered 15.56%. But no return comparison is complete without adjusting for inflation and the average Inflation during this period was 7.79%. Hence, the nominal and real returns are as follows:
| Nominal Returns (in %) | Real Returns ^ (in %) | |
| BSE- Sensex | 15.5 | 7.8 |
| Gold | 8.5 | 0.8 |
| Fixed Deposit | 8.9 | 1.1 |
^ Real return = Nominal Return less Inflation
We have not included taxation and dividend yield (about 2%) and tried to keep the comparison simple.
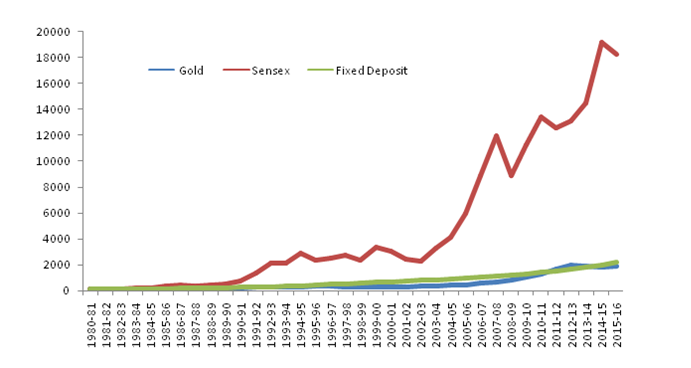
Chart: Rs. 100 taken as base,
Data Source: RBI, Inflation.edu
Basically, Rs. 1 lakh invested in all the three investments in 1980 till mid 2016 would yield the following:
| Nominal Value | Real Value | |
| BSE- Sensex | 1.8 Cr | 15 L |
| Gold | 19 L | 1.3 L |
| Fixed Deposit | 21 L | 1.5 L |
Additionally, Gold prices in India have benefited immensely through rupee depreciation. Consider this – the annual returns of Gold in Dollar terms for the past 36 years is a mere 2.3% while in Rupee terms the Mumbai bullion returns for 10 gms of gold is 8.10%. The difference of 5.8% is majorly due to rupee depreciation and duties. Even if we consider the best period of Gold returns in India i.e. from 2001-2016, the same is 13% while from BSE Sensex the returns are at 12.6% (this does not consider the dividend yield of about 2%)
Now to turn to FD – the product is highly tax inefficient. For a 30% tax bracket investor, a 9% FD yields a post-tax return of 6.30% which adjusted to inflation yields negative returns!
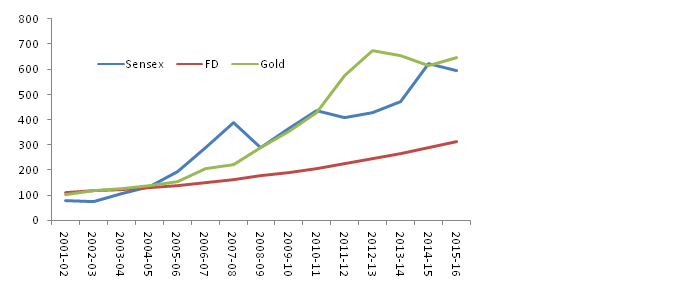
Chart: Rs. 100 taken as base, Data Source: RBI, Inflation.edu
Having said that, I believe the period from 2000-2001 onwards was a ‘Dream Phase’ as rarely have we seen all the asset classes delivering stellar returns. So investors were spoilt for choice, and if they managed to pick Gold or Equities over Fixed Deposit, they multiplied their money manifold. To give you an idea – Gold has multiplied 6.5 times in this period, Equities about 6 times and Fixed Deposit about 3 times.
Anyhow the purpose of this analysis is to throw some hard data on Gold and Fixed deposit as investment choices and not to make any forward-looking statements based on past data. I do not foresee such spectacular returns on a sustained basis from any asset class, not even Equities, and my return expectations are far more moderate. At this time, the key factor that will impact your financial success would be the ASSET ALLOCATION strategy used for your investments. Hence it is important for you to go through a financial planning exercise and make investment choices that make specific sense to your investable surplus, risk profile and liabilities.
Other key pointers I want to share at this point are:
- As an investor, you must keep an eye on inflation not just as a number but from a returns perspective as the historical data suggests that despite poor inflation adjusted returns not many investors have invested wisely in the past. (Follow these 5 Steps when kickstarting investments)
- The Sensex returns show that Equities have multiplied wealth faster than Gold and FD for investors who invested in Equities over a longer period.
- Mutual Funds have delivered far more superior returns than the benchmark in the past
- Gold has delivered stellar returns in the recent past but over a 30 year period has done extremely poorly and given returns similar to fixed deposit albeit at a higher risk
- Debt products provide superior returns adjusted to risk compared to Gold (Gold being an international commodity)
- Gold may find position only as a tactical call on any global crisis or as a hedge but otherwise it would be wise to keep the allocation low

![CropperCapture[3]](http://equestcapital.com/wp-content/uploads/2016/10/CropperCapture3.jpg)
![CropperCapture[4]](http://equestcapital.com/wp-content/uploads/2016/10/CropperCapture4.jpg)