admin No Comments

Why Equity Investors Earn Risk Premium – No Pain No Gain

Owning equities is about living in regret for 94 percent of the time – a strong reason for getting paid an extra reward called equity risk premium.

Most market participants conflate risk with beta and volatility. Risk is neither. Risk is about drawdown, it is about loss of capital. When one looks at the drawdown of the BSE Sensex over three-and-a-half decades, it is evident why equity investors earn a premium return over bond investors and other categories of investments.

Indeed, for an investor in the Sensex, 94 percent of the past three and a half decades has been spent in regret – that is, at prices lower than the trailing high. Compare that with a fixed deposit, for which an investor spends zero percent of his time in regret, since the subsequent values are always higher than the previous day’s value (except in the event of a bank blow-up – a very rare event in India).

In fact, Sensex data shows that 57 percent of the time investors have the pain of experiencing at least a 10 percent loss, and 34 percent of the time that of a 20 percent loss (read that again: one in three days of an investor’s holding period).

The drawdown of the Sensex plots a Pareto distribution and explains why equity investors need to be compensated for their investments – they bear a lot of pain most of the time.

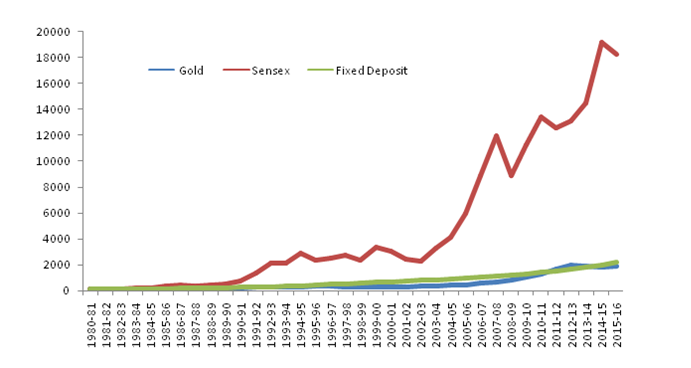
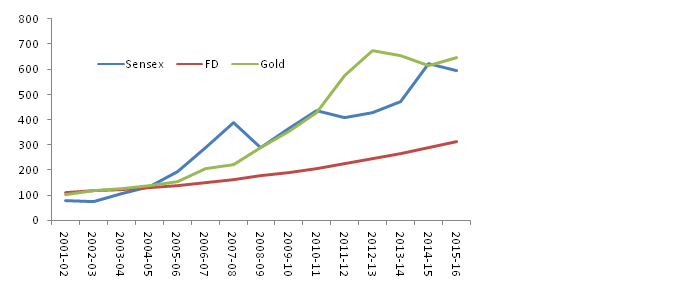
 As the saying goes, equity investing is not for the weak-hearted. Why would one say that when it is clear from a slew of data that equities have been the best-performing asset class over long time frames, at least in India? Equities have beaten real estate, treasuries, and fixed deposits quite nicely over 10 and 20 years.

As we know, this excess return that equities earn is known as equity risk premium. Why should equities earn an excess return? What is so special about equities? Is it because equities tend to be more volatile than bonds and other asset classes, or is it because equities are a junior claim on the company’s cash flows and assets and therefore more risky in nature. Well, it is all of these factors.

However, the most important factor, in our view, is that equity investors spend most of their lives in regret after purchasing shares.

This regret means that it takes a special quality to be an equity investor. It means that only a minority of the world’s population (or more specifically in the current case, India’s population) dares or cares to own equities. The rarity of an equity investor, as a result of the enormous regret or pain involved in owning stocks, is the key reason equities generate excess returns, i.e., equity risk premium.

Let us explain this using the BSE Sensex as a proxy for equity investment. If one goes back three-and-a-half decades, the BSE Sensex has compounded at an astonishing pace of 16 percent annually. However, this compounded annual rate of return hides some sinister stuff – 94 percent of the time the index has been lower than its preceding high; 57 percent of the time the index has been 10 percent lower than its preceding high; and 34 percent, or one in three days, it has been 20 percent or more lower than the preceding high. The average and median drawdowns are 17 percent and 13 percent respectively. These are important numbers. The psychological impact is massive.

The thought that I could have waited to purchase shares, that I bought them in a hurry, produces enormous stress for the equity holder. This stress generally drives away existing and potential investors.

Realised Equity Risk Premium As A Timing Tool

The premium that equity investors earn over bonds does not plot a horizontal line, that is, it is not a constant. It varies with investor sentiment towards both asset classes. The underlying mean reverting characteristic makes realised equity risk premium (ERP) a useful timing tool. The danger of mean reverting variables is that the precise moment of mean reversion is never known, so the utility of implied ERP as a timing tool is only available to genuinely non-levered long-term investors. In the environment we are in today, even the ardent equity investor is giving up relative to long bonds. We cannot predict the moment of mean reversion, but we can say that the long-term equity investor is probably poised for better-than-average excess returns over long bonds in the coming years from the current starting point.

Ridham Desai is managing director at Morgan Stanley India and also serves as head of equity research and India equity strategist.

The views expressed here are those of the author’s and do not necessarily represent the views of BloombergQuint or its editorial team.

Source: BloombergQuint
admin No Comments

Investing Decisions- The Rabbit & Hare way

Kahneman-300x190

Take a look at the picture on your right, make a guess on which of the two lines is longer!

You may want to measure it with a ruler to confirm that both the lines are of the same length!! Not all illusions are visual, we take a look at how some of such illusions lead us to take some financial decisions that we do. But before that let us understand the two systems that lead us to take decisions.

TWO SYSTEMS

System-1-vs-System-2

SYSTEM 1 operates automatically and quickly, with little or no effort and no sense of voluntary control

SYSTEM 2 allocates attention to the effortful mental activities be it complex decisions, numerical calculations, the conscious reasoning self that has beliefs, makes choices, and decides what to think about and what to do.

While the Rabbit (SYSTEM 1) will provoke us to take quick, easy, default decision, but the Hare (SYSTEM 2) will provoke us to be logical, analytical and take a step back before taking any decision.

It’s interesting how we can draw an analogy to some of the investment decisions we have been making and continue to make.

Automated Investment Decisions

 Savings Deposit

Most preferred mode of saving and keeping idle short term money is through savings deposit. This is an auto mode of keeping money .

Fixed Deposit

A preferred alternate to Savings deposit is Fixed Deposit due to higher returns. The returns are taxable and the interest rates have been declining steadily over the past 2 decades.

PPF

Public Provident Fund (PPF) is a popular tax saving plan which offers tax benefit and government backing making, but as highlighted in our previous article (PPF VS ELSS) for a 15 year investment horizon, one may want to explore other alternates depending upon the risk appetite.

Insurance-Investment Plan

A mix of insurance and investment  are the most popular form of insurance plans popularized by a large public sector insurance company. They are bought by people looking for Insurance without cGost or think that Insurance is a cost and should be bundled with investment only!

Gold

One of the most favored investment of the Indians has been Gold due to a host of reasons, primarily because its a legacy investment, passed on from generations to the next one. But few would agree that the returns of gold has been in line with fixed deposit returns over the past 30 years,  ! (Gold, Fixed Deposits & Equities- Making the Right Choice)

Effortful Investment Decisions

Liquid Funds

These are short term mutual funds ideal for less than a year period. This is an alternate to savings deposit offers far better returns though not guaranteed. Now the risk reward for this investment is so favorable yet not many people explored this alternate.

Term Insurance

A classic example of the system 2 agnostic investor decision behavior is prevalent in Life Insurance the most. Life Insurance for practical purposes is a form of protection, transfer of FINANCIAL RISK. As per Wikipedia

Insurance is a means of protection from financial loss. It is a form of risk management primarily used to hedge against the risk of a contingent, uncertain loss.”

As MINT newspaper points, PERSISTENCY RATIO, which measures how long customers stay with their policies by considering the premium renewals throws a very bleak picture

According to figures of financial year 2015, as reported by the insurance regulator in its handbook of statistics, the industry, on an average, reported a persistency of 59% in the 13th month. In other words, out of 100, just 59 policies got renewed. In fact, the average persistency for the 61st month is about 22%, which means by the end of the fifth year, only 22 policies got renewed.

Debt Funds

A not so complex investment product perceived complex as the returns aren’t guaranteed but look at the past tax adjusted returns one would be surprised that the risk is not with the product but more so in lack of understanding the nature of the product. Unlike Equity Mutual Funds, which invests in Equities and have a longer term horizon for investment, debt funds are of various types and offers excellent avenues for returns for anyone looking to deploy money for short to medium term.

Equity Funds

Historically, one of the best asset class (Gold, Fixed Deposits & Equities- Making the Right Choice) with returns far superior to any other investment. Also the only investment which, if held over a one year period attracts NIL TAX. Ideally, this should have been a part of a majority of an investor’s portfolio! Till January 2016 the total number of investors in India stood at 4.58 crores so about 4% of the population! So clearly the risk return matrix is not understood by a majority.

Our basic premise of this article was to share some interesting behavioral aspect which I come across when investors were being naïve about their Investment decisions. What has worked for a generation earlier became their default investment behavior too! One may have the risk appetite to invest in slightly riskier return and while some may not, its time to check that and JOIN OUR CIRCLE.

JOIN OUR CIRCLE

Your circle comprises of the people you trust and turn to for advice. It is that sense, your home. At Equest Capital, we take this circle of trust very seriously and are fully committed to everyone who join ours. Giving you advice that serves your need instead of selling a product is just one of the many ways we honour this responsibilty.

References: Nobel Laureate in Economics, Daniel Kahneman book on thinking fast and slow
Disclaimer: This is a generic article meant for private circulation, please do consult you financial advisor before taking any investment related decision.
admin No Comments

Gold, Fixed Deposit & Equities – Making the right investment choice

Quite often I find investors cling on to their investments and lose sight of other opportunities with better risk and return profiles. Gold and Fixed Deposit (FD) are two such favored traditional investment products which have found a lot of takers. Gold and FD have historically been legacy products, more so Gold which is an inextricable part of Indian tradition. We pass it on to the next generation and believe that it is the safest and most wise investment choice and shall be our last resort during bad times. FD has been more of a default investment choice for most investors besides traditional insurance policies. I find these choices strange because while FD offers extreme safety with fixed returns, Gold is highly risky with returns linked to geopolitical factors, currency fluctuations and a host of other factors which aren’t domestic.

The comparison between these two asset classes and Equities throws up some interesting findings in favour of Equities. However, that doesn’t necessarily answer the question of which of these is the right investment choice for you. Read on to know more on that.

Fixed Deposit vs. Gold vs. Equities

Cutting to the chase, for the last 35 years, in absolute terms Gold has delivered a return of 8.52%, Fixed Deposit 8.91% and Equities (BSE Sensex) has delivered 15.56%.  But no return comparison is complete without adjusting for inflation and the average Inflation during this period was 7.79%.  Hence, the nominal and real returns are as follows:

Nominal Returns (in %) Real Returns ^ (in %)
BSE- Sensex 15.5 7.8
Gold 8.5 0.8
Fixed Deposit 8.9 1.1
^ Real return = Nominal Return less Inflation
We have not included taxation and dividend yield (about 2%) and tried to keep the comparison simple.
gold 2
Chart: Rs. 100 taken as base,
Data Source: RBI, Inflation.edu

Basically, Rs. 1 lakh invested in all the three investments in 1980 till mid 2016 would yield the following:

Nominal Value Real Value
BSE- Sensex 1.8 Cr 15 L
Gold 19 L 1.3 L
Fixed Deposit 21 L 1.5 L

Additionally, Gold prices in India have benefited immensely through rupee depreciation. Consider this – the annual returns of Gold in Dollar terms for the past 36 years is a mere 2.3% while in Rupee terms the Mumbai bullion returns for 10 gms of gold is 8.10%. The difference of 5.8% is majorly due to rupee depreciation and duties. Even if we consider the best period of Gold returns in India i.e. from 2001-2016, the same is 13% while from BSE Sensex the returns are at 12.6% (this does not consider the dividend yield of about 2%)

Now to turn to FD – the product is highly tax inefficient. For a 30% tax bracket investor, a 9% FD yields a post-tax return of 6.30% which adjusted to inflation yields negative returns!

gold 3

Chart: Rs. 100 taken as base, Data Source: RBI, Inflation.edu

Having said that, I believe the period from 2000-2001 onwards was a ‘Dream Phase’ as rarely have we seen all the asset classes delivering stellar returns. So investors were spoilt for choice, and if they managed to pick Gold or Equities over Fixed Deposit, they multiplied their money manifold. To give you an idea – Gold has multiplied 6.5 times in this period, Equities about 6 times and Fixed Deposit about 3 times.

Anyhow the purpose of this analysis is to throw some hard data on Gold and Fixed deposit as investment choices and not to make any forward-looking statements based on past data. I do not foresee such spectacular returns on a sustained basis from any asset class, not even Equities, and my return expectations are far more moderate. At this time, the key factor that will impact your financial success would be the ASSET ALLOCATION strategy used for your investments. Hence it is important for you to go through a financial planning exercise and make investment choices that make specific sense to your investable surplus, risk profile and liabilities.

Other key pointers I want to share at this point are:

  • As an investor, you must keep an eye on inflation not just as a number but from a returns perspective as the historical data suggests that despite poor inflation adjusted returns not many investors have invested wisely in the past. (Follow these 5 Steps when kickstarting investments)
  • The Sensex returns show that Equities have multiplied wealth faster than Gold and FD  for investors who invested in Equities over a longer period.
  • Mutual Funds have delivered far more superior returns than the benchmark in the past
  • Gold has delivered stellar returns in the recent past but over a 30 year period has done extremely poorly and given returns similar to fixed deposit albeit at a higher risk
  • Debt products provide superior returns adjusted to risk compared to Gold (Gold being an international commodity)
  • Gold may find position only as a tactical call on any global crisis or as a hedge but otherwise it would be wise to keep the allocation low
admin No Comments

PPF Vs ELSS: The battle of unequals

Public Provident Fund (PPF) and Equity Linked Savings Schemes (ELSS) are amongst the popular investment options for tax saving. While PPF invests in government bonds, ELSS invests in equities, so the former is almost risk-free (unless the government defaults) while the latter is a market linked investment.  Let’s look at both these options in detail.

PPF

PPF is a  central government backed debt instrument which offers fixed returns*. In this option both the principal investment (up to Rs. 1.5 Lakhs under section 80C) and maturity amount are completely tax exempt making it a safe investment avenue.

* interest rate revision linked to average G-sec yield

PPF Rates

Period PPF Interest Rates
01-Apr-1986  to  14-Jan-2000 12%
15-Jan-2000  to  28-Feb-2001 11%
01-Mar-2001  to  28-Feb-2002 9.50%
01-Mar-2002   to  28-Feb-2003 9%
01-Mar-2003  to  28-Mar-2011 8%
01-Apr-2011  to  31-Mar-2012 8.60%
01-Apr-2012  to  31-Mar-2013 8.80%
01-Apr-2013   to  31-Mar-2016 8.70%
01-Apr-2016 onwards 8.10%

PPF and Inflation

Any investment is typically looked at from returns or tax perspective, but it is also prudent to factor in inflation and evaluate the real returns.

The chart below shows the PPF rates against the average rate of inflation. Starting 2009 and up until 2013, the inflation percentage hovered around double digits in effect making the real return from PPF negative for those 5 years.

 CropperCapture[3]

Source: CPI Average Inflation from Inflation.edu

This shows just how important a factor inflation is and why the decision to pick an investment option should consider the inflation expectation. For example, if you invest in a PPF for your child’s higher education while the inflation expectation as regards education costs is 8% then it is clearly not a wise choice.

ELSS

Equity Linked Savings Schemes are investments made in diversified equity mutual funds with a compulsory lock-in of 3 years. It is one of the most popular products for tax saving as it offers benefits with a lower lock-in period compared to other products in the segment.

PPF Vs. ELSS

The comparison between these two products is a bit like comparing apples to orange considering one is risk-free, and the other is market linked. However, it is fruitful to see how they peg against each other.

PPF ELSS
Type Debt Market Linked

Risk category
Low High
Tax EEE EEE
Lock-In 15 years 3 years
Withdraw partially from 6th year^ Anytime after 3 years
Returns 8.10% Not Guaranteed

^ Only for medical emergency or higher education with 1% premature penalty

Comparison of historical returns

If Rs. 1 Lakh were invested in BSE Sensex in 2001 the amount would now grow to Rs. 6,71,379 implying a return of 13% while the same amount in a PPF investment would return Rs. 3,49,841 implying a return of 8.41%.

CropperCapture[4]

My View

Any investment decision should consider the risk profile of the investor and time horizon of the investment.  While comparing two different products may serve a theoretical purpose, but as an investor, if you don’t have the risk appetite to invest in a market-linked instrument, then the comparison if of little use to you.  My objective in this article is hence to give you a perspective and help you understand that these two investments have varied risk and return profiles. Given below are a few scenarios to throw some more light on the PPF vs. ELSS debate.

  1. If you already have an existing equity or equity mutual fund portfolio tagged to your goals then, the Asset Allocation strategy should be followed with the aim to achieve your target return. PPF scores high as a part of your core debt portfolio while ELSS offers exposure to equity with a lower lock in period.
  2. If you DO NOT have any equity or equity mutual fund in your portfolio, then for tax benefit purpose it would be prudent to start with ELSS. I would also advise you to understand the basics of inflation and power of compounding to make the most of your investment, because truth be told, investing for only the lock-in period of 3 years and then withdrawing may not yield the desired result.
  3. If you are below 30 and a first-time investor, then ELSS offers the ideal route. The propensity to take risks goes down with age and other commitments, hence this sweet spot should be used for building long-term wealth.
  4. Conversely, if you are someone nearing retirement, then it would be advisable to have a conservative portfolio and ELSS should be added if and only if your remaining portfolio is skewed towards debt or non-equity products.


Image Courtesy : Wikipedia / Wikimedia
admin No Comments

5 rules to follow when kickstarting your investments

POST BY AMIT KUMAR

“Do not go where the path may lead, go instead where there is no path and leave a trail.”
– Ralph Waldo Emerson

Any investment decision should be akin to taking a decision when running a business. And much like an entrepreneur, one should start one’s investment journey on a sound foundation. The list below gives the necessary framework to kick-start your investment journey

Rule #1: For a successful investment, beat inflation

‘Money saved is money earned’ is just a myth. In today’s world, money only has value if it earns over and above inflation. For a majority of investors, the ideal way is to assess future expenses by projecting inflation over a longer period and according to the nature of the spend; for instance –  education inflation at 8-10%, household expenses at 5-6% and so on. This way the risk of being under-invested is mitigated to an extent.

Rule #2: Invest in products with higher returns than a fixed deposit

A majority of investors that I meet restrict their investments in capital markets to equities and invest in fixed deposit when it comes to debt. What is interesting to note is that the inflation and tax adjusted return from a fixed deposit barely matches the inflation rate. You can read more about this in my article that highlights the returns from a Fixed Deposit over a 35 year period.

As an investor, you have to remember that debt as a category has multiple options which give better tax-adjusted return. For instance, for the last 35 years, Gold has delivered a return of 8.52% in absolute terms, while Fixed Deposit has delivered a return of 8.91% and Equities (BSE Sensex) has delivered 15.56%.  While the average inflation during this period was 7.79%. So net of tax, a Fixed Deposit gives return in the range of 5-7% depending upon the tax bracket.  

Rule #3: Never mix your investments with insurance, keep them separate

An investment product along with insurance is a deadly cocktail which most of the investors fail to notice till it’s too late. Traditionally insurance products are packaged the way most Bollywood movies are packaged, that is as a combination of a bit of everything, ‘a bit’ being the operative phrase. The return on such plans is not more than 5-7% and at times they don’t even provide sufficient cover. And for these reasons, it is best to consider pure term insurance to safeguard yourself and your family against risks and keep your investments separate.

Rule #4: Follow goal-based investing

More often than not, I meet investors who arbitrarily invest a certain amount in a Systematic Investment Plan and consider it sufficient to take a term cover based on the current financial condition. What they completely disregard are their future liabilities and expenses, while there is no risk bigger than being under-insured. After all the onus of protecting one’s family goes beyond one’s lifetime.

The ideal approach is to follow our five steps to financial success wherein we help you assess your goals, calculate your net worth, then check the gap between the two and implement a suitable plan and regularly review it. You can also read about the approach here.

Rule #5: Be a disciplined investor

One of the simplest yet not often appreciated aspect of investing is the discipline required towards achieving one’s’ goals.  Quite often the biggest enemy of an investor is the investor himself.  Saving, investing and growing your wealth requires you to have a disciplined approach and stay the course as there are often too many distractions and much short-term noise along the way.  It is when you stick it out for the term of the investment that you enjoy the benefits of the power of compounding.

One word of advice as a parting note – superior internet speeds and user-friendly transaction technologies have ushered in a new era of investments via ‘click and transact’. However, this could be a bane as the tendency to keep logging in to check your portfolio and make changes is very high. Ideally, you should use such technology platforms for their ease and convenience but ensure you don’t act out of impulse against your investment goals.


admin 3 Comments

5 steps to financial success & planning a birthday party

The phrase ‘financial success’ or for that matter any phrase with ‘financial’ as prefix gives an impression of being highly complex. Most people consider it will involve a lot of calculating and analysis and get put off by the very thought.

But look closely and all that poor word means is ‘to do with finances’; in other words, to do with money, in this case, your money. Something you use every day from the time you pull into a petrol pump before your morning ride to work to the time you use your credit card to pay for dinner.

Add ‘success’ in this mix and all the phrase really means is how to win with your money. Now how can that be such a bad thing?

Moving on to the 5 steps, I could do a similar deconstruction of Goal Assessment, Networth Assessment, Need Gap Analysis, Planning & Implementation, and Review. But instead, let’s do something more fun. Let’s plan my niece’s 5th birthday party which falls in a year.

So let’s start by penning down some specifics – how many people are to be invited, what kind of food will be served, what kind of venue do I want and how much will all of this cost me in a year. How these details will help is that they will ensure I can put together the best surprise party for my niece. You do the same thing for your life plans with a financial planner, and it’s called Goal Assessment.

Next, comes figuring out what all I have around the house to plan my party. So I go around and look through last year’s supplies and find that I have some 50 party hats and 25 party favours. I also have a holiday home not far from the city which can be my venue. In the financial world when you make a comprehensive list of everything you own it’s called Assessing your Networth.

Next, comes a fun step, I take my two lists of everything I want to get done for this party and everything I have in terms of resources for it, and I check where I’m falling short. I have 80 guests and 50 party hats for instance; so I need to provision for 30 more. I also need 55 party favours, a catering service, princess theme decor and cake. All this put together will cost Rs. 35,000 in about a year but my brother only has Rs. 30,000 to spend, so I am looking at a shortfall of Rs. 5000. My financial planner calls this step the Need Gap Analysis.

Now to plan for my shortfall, I call up my friend and financial planner and tell him to invest this money for me in such a way that I will have Rs. 35,000 in one year. This he calls Financial Planning and Investment.

In one year, I get Rs. 35,000 and am able to plan a beautiful surprise party for my niece. My financial planner is also invited and over cake and coffee, we discuss the next big surprise party for her 10th birthday, and he suggests a plan for it. In other words, he does a Review, and we start over right from Step 1. Now that wasn’t so complicated, was it? In fact only logical.

And while I took a fairly short term goal as an example and one that doesn’t cost too much; The principle pretty much remains the same – not matter how large your goals or how varied. If the idea of putting your life out on the table still worries you, start simple – not with a birthday party but maybe an expensive vacation or the house of your dreams. Sit with your financial planner and do the same exercise for yourself and if at any point you start getting bogged down by obscure financial terms think of your life as one big party and then get party planning.

Read more about starting your financial planning journey here.